
Premier Metrics, Admin Dashboard
The office dashboard behind a mobile timer app. React and TypeScript on Vite with Supabase and Vercel: monthly totals by location and therapist, Recharts reporting, shift detail, and export to Excel and CSV.
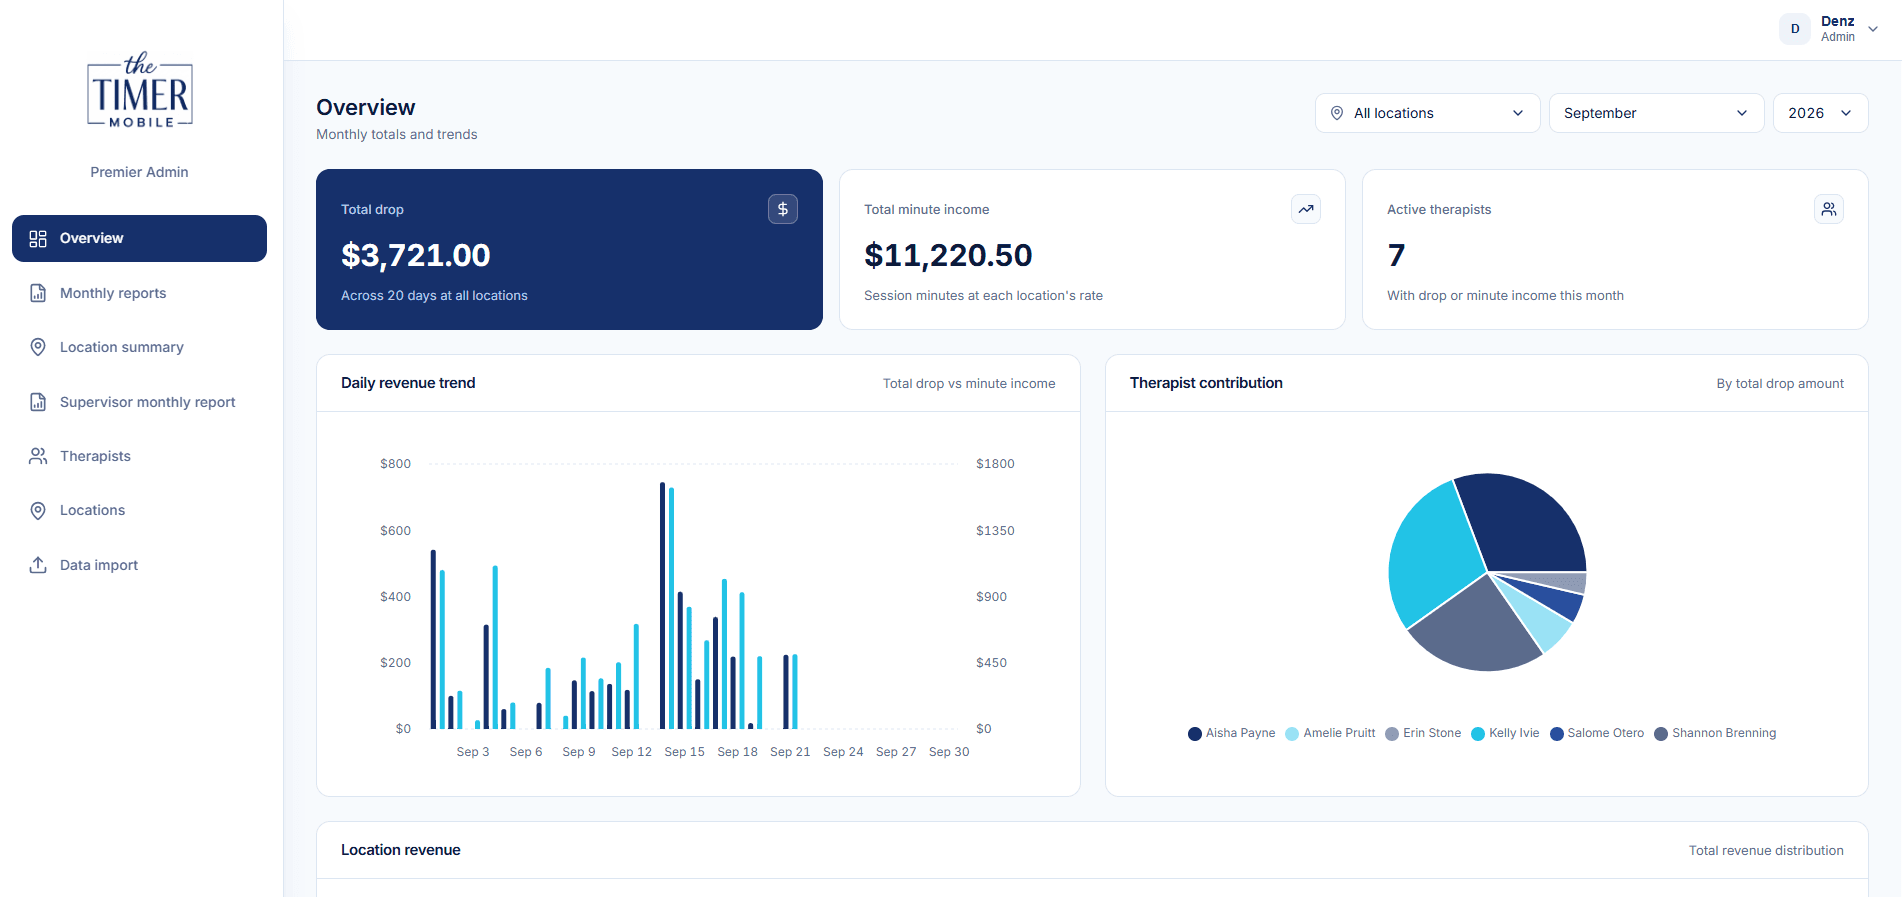
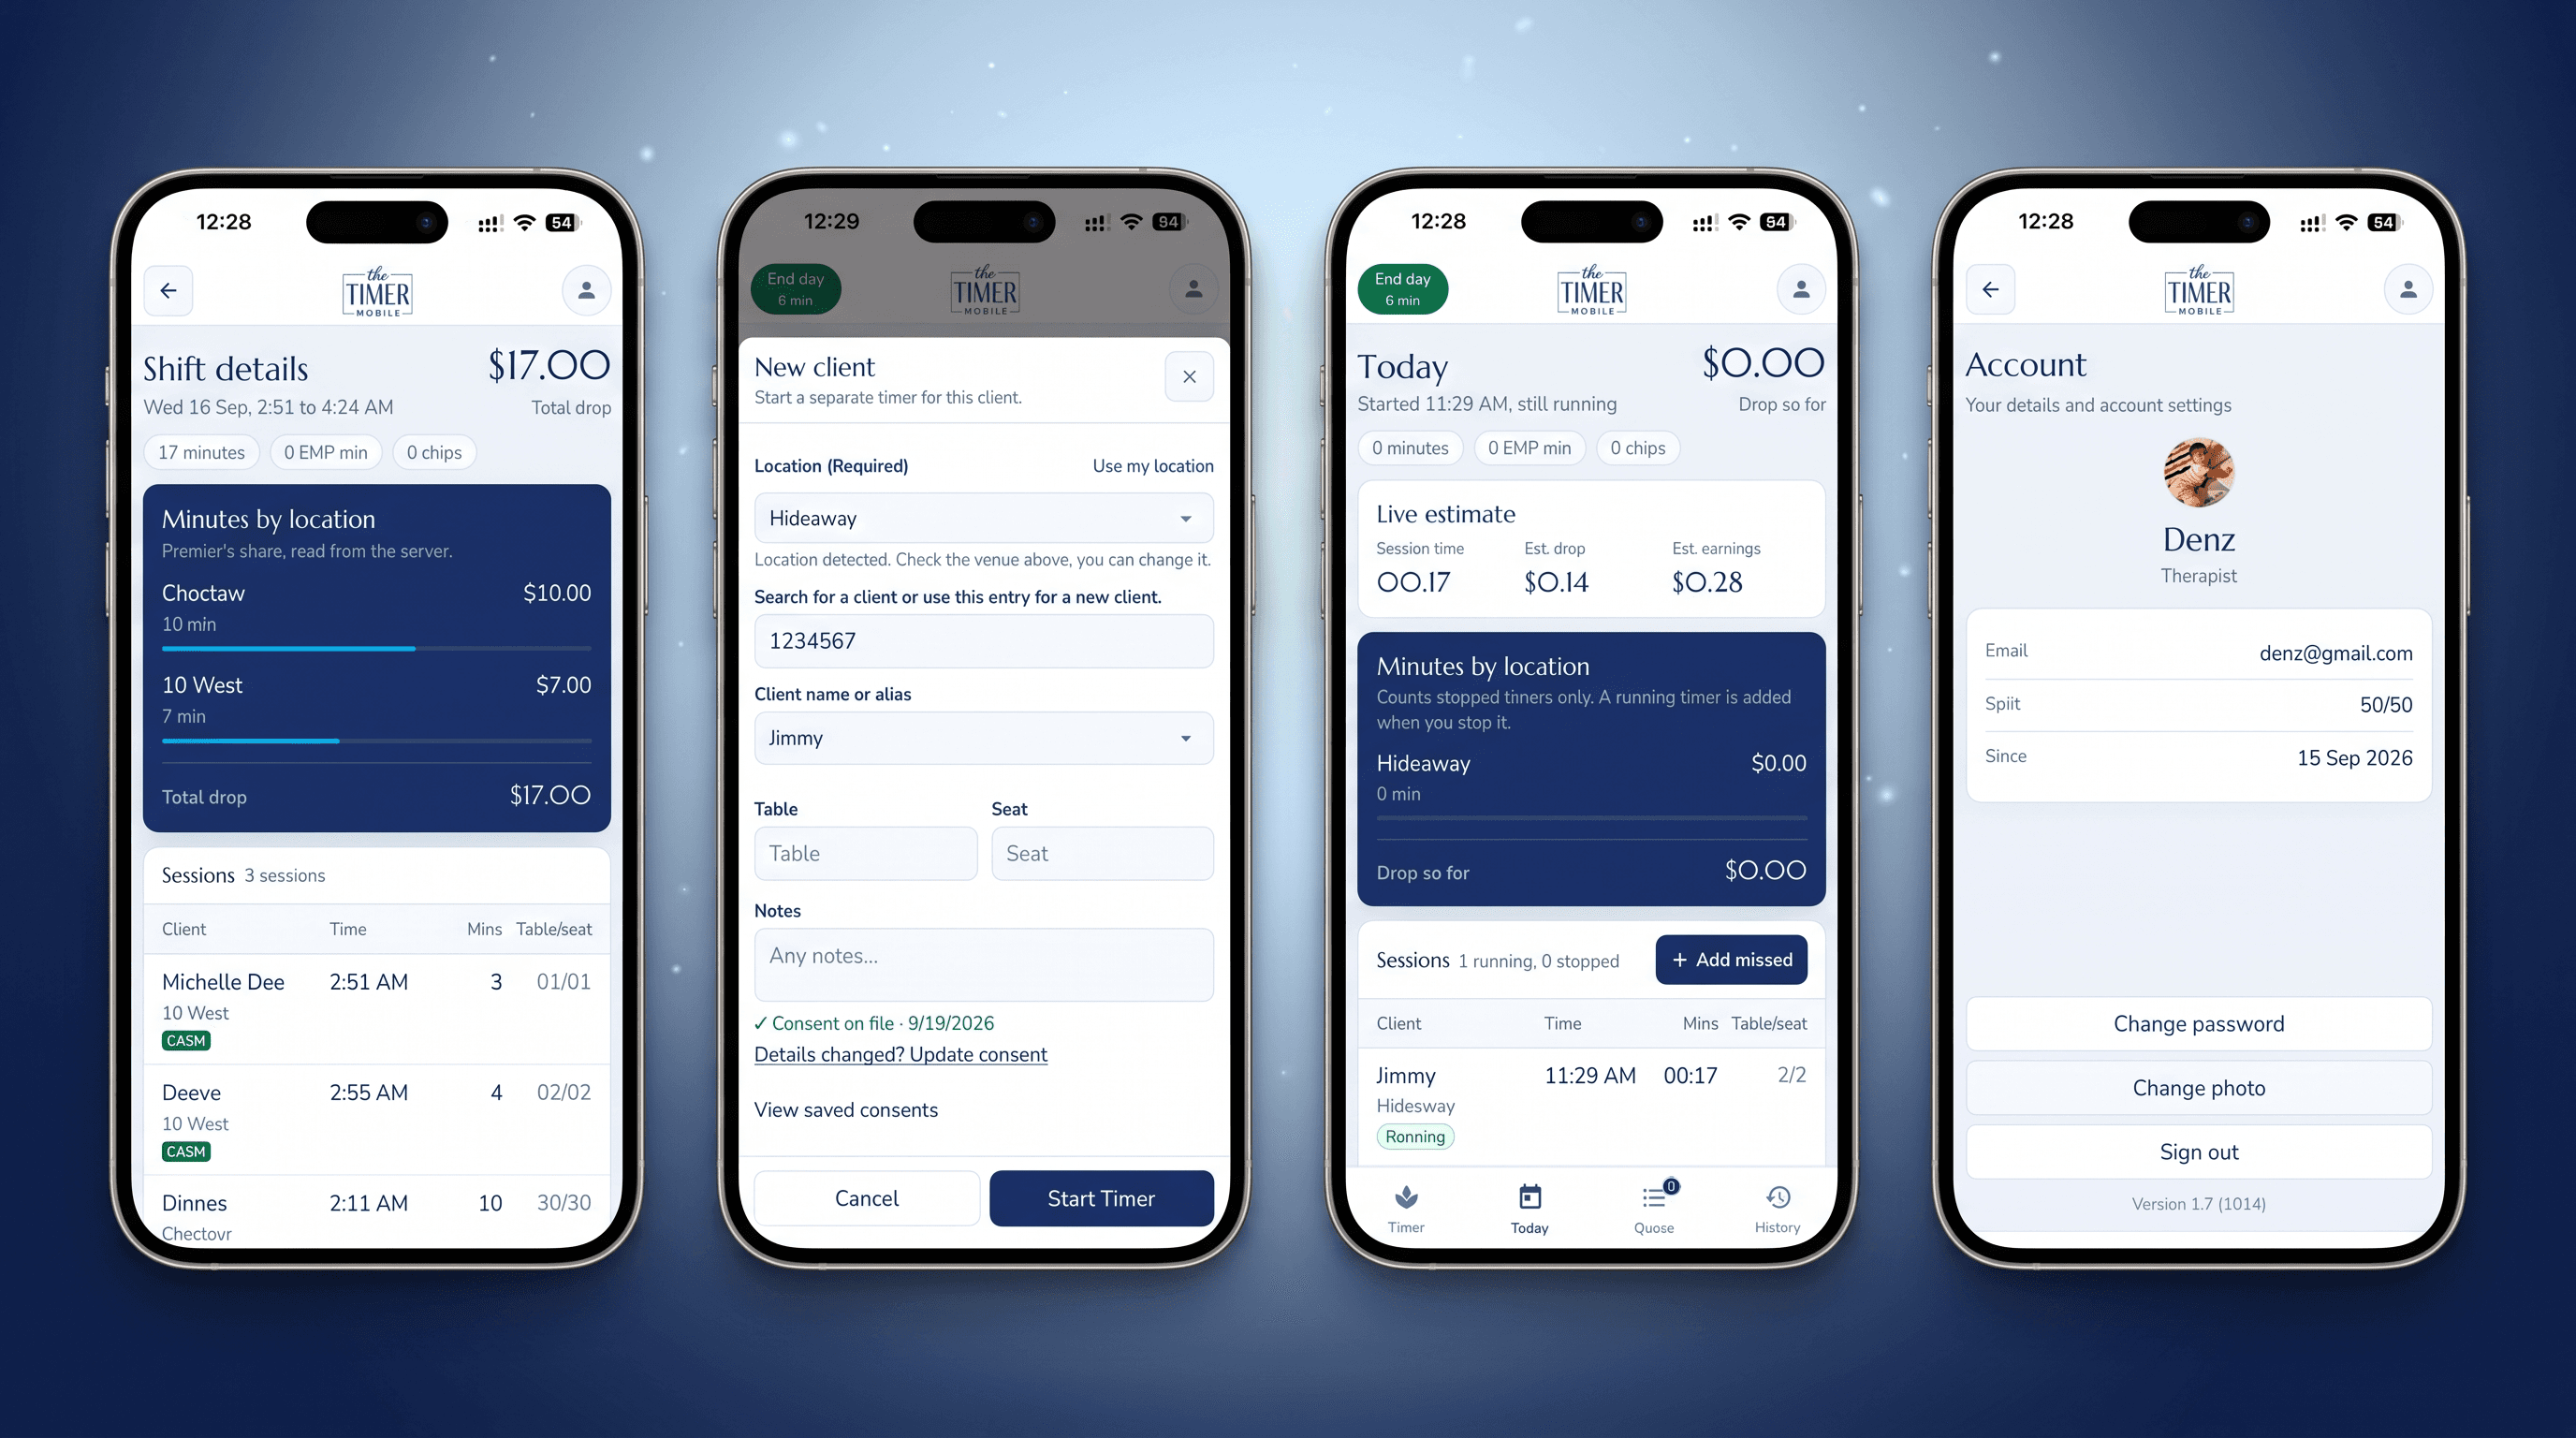
Premier Metrics is the office side of a mobile timer app. React and TypeScript on Vite, Supabase behind it, deployed on Vercel at premier-metrics.com.
The phones collect. This is where the numbers are read, filtered, checked and exported.
What was in the way
The mobile app records a session per client: minutes, venue, table and seat, paused and resumed.
That is the right shape for a therapist standing on a casino floor. It is the wrong shape for the office, which needs a month at a time, by location, by therapist, reconciled against what each venue owes.
Doing that from the raw table means somebody writing SQL every week, which means it does not get done.
Five parts, each with a reason
One screen that answers the first question
The overview carries the month's totals across all locations, with a location, month and year filter on the same row. Total drop, minute income at each location's rate, and how many therapists were active.
Export, because the office works in spreadsheets
Excel through ExcelJS and CSV through PapaParse. There is also a data import page, so historical records from before the app existed can be brought in rather than retyped.
Charts that match how the money is split
Three charts, built on Recharts: a daily bar chart comparing drop against minute income, a pie of contribution per therapist, and a pie of revenue per location.
Each one exists because a specific argument used to happen: which day was quiet, who is carrying the month, and which venue is worth keeping.
Locations on a map
Venues managed on their own page with the Google Maps API, so a location is a record with coordinates rather than a string somebody spells differently each time.
Reports per audience
Separate pages for the monthly report, the per-location summary, the supervisor monthly report, the queue report and the individual shift detail. A therapist's own history is its own page.
The commission split is a hook of its own, because the split is per therapist and has to survive rate changes without rewriting history.
The engineering underneath
React 19 with TypeScript, built by Vite and deployed to Vercel as static files with an SPA rewrite.
Server state runs through TanStack Query, so the dashboard reflects what the phones just wrote without a refresh button. Dates go through date-fns, icons through Lucide.
It reads the same Supabase project as the app: eleven tables including sessions, shifts, staff, customers, locations and time adjustments. Access is enforced at the database with row level security rather than in the client, which is the only defensible place for it when a phone app and a browser app read the same rows under different roles.
Auth is email and password with a separate set-password page, so the office can be invited rather than handed a shared login.
See it live
Premier Metrics, Admin DashboardThe live site · www.premier-metrics.comPremier Timerthe iOS and Android app it reports on · View projectHire me for this
Full-Stack Web DevelopmentFrom $14/hrMobile App DevelopmentFrom $14/hrHosting & Server ManagementFrom $14/hrProjects like this
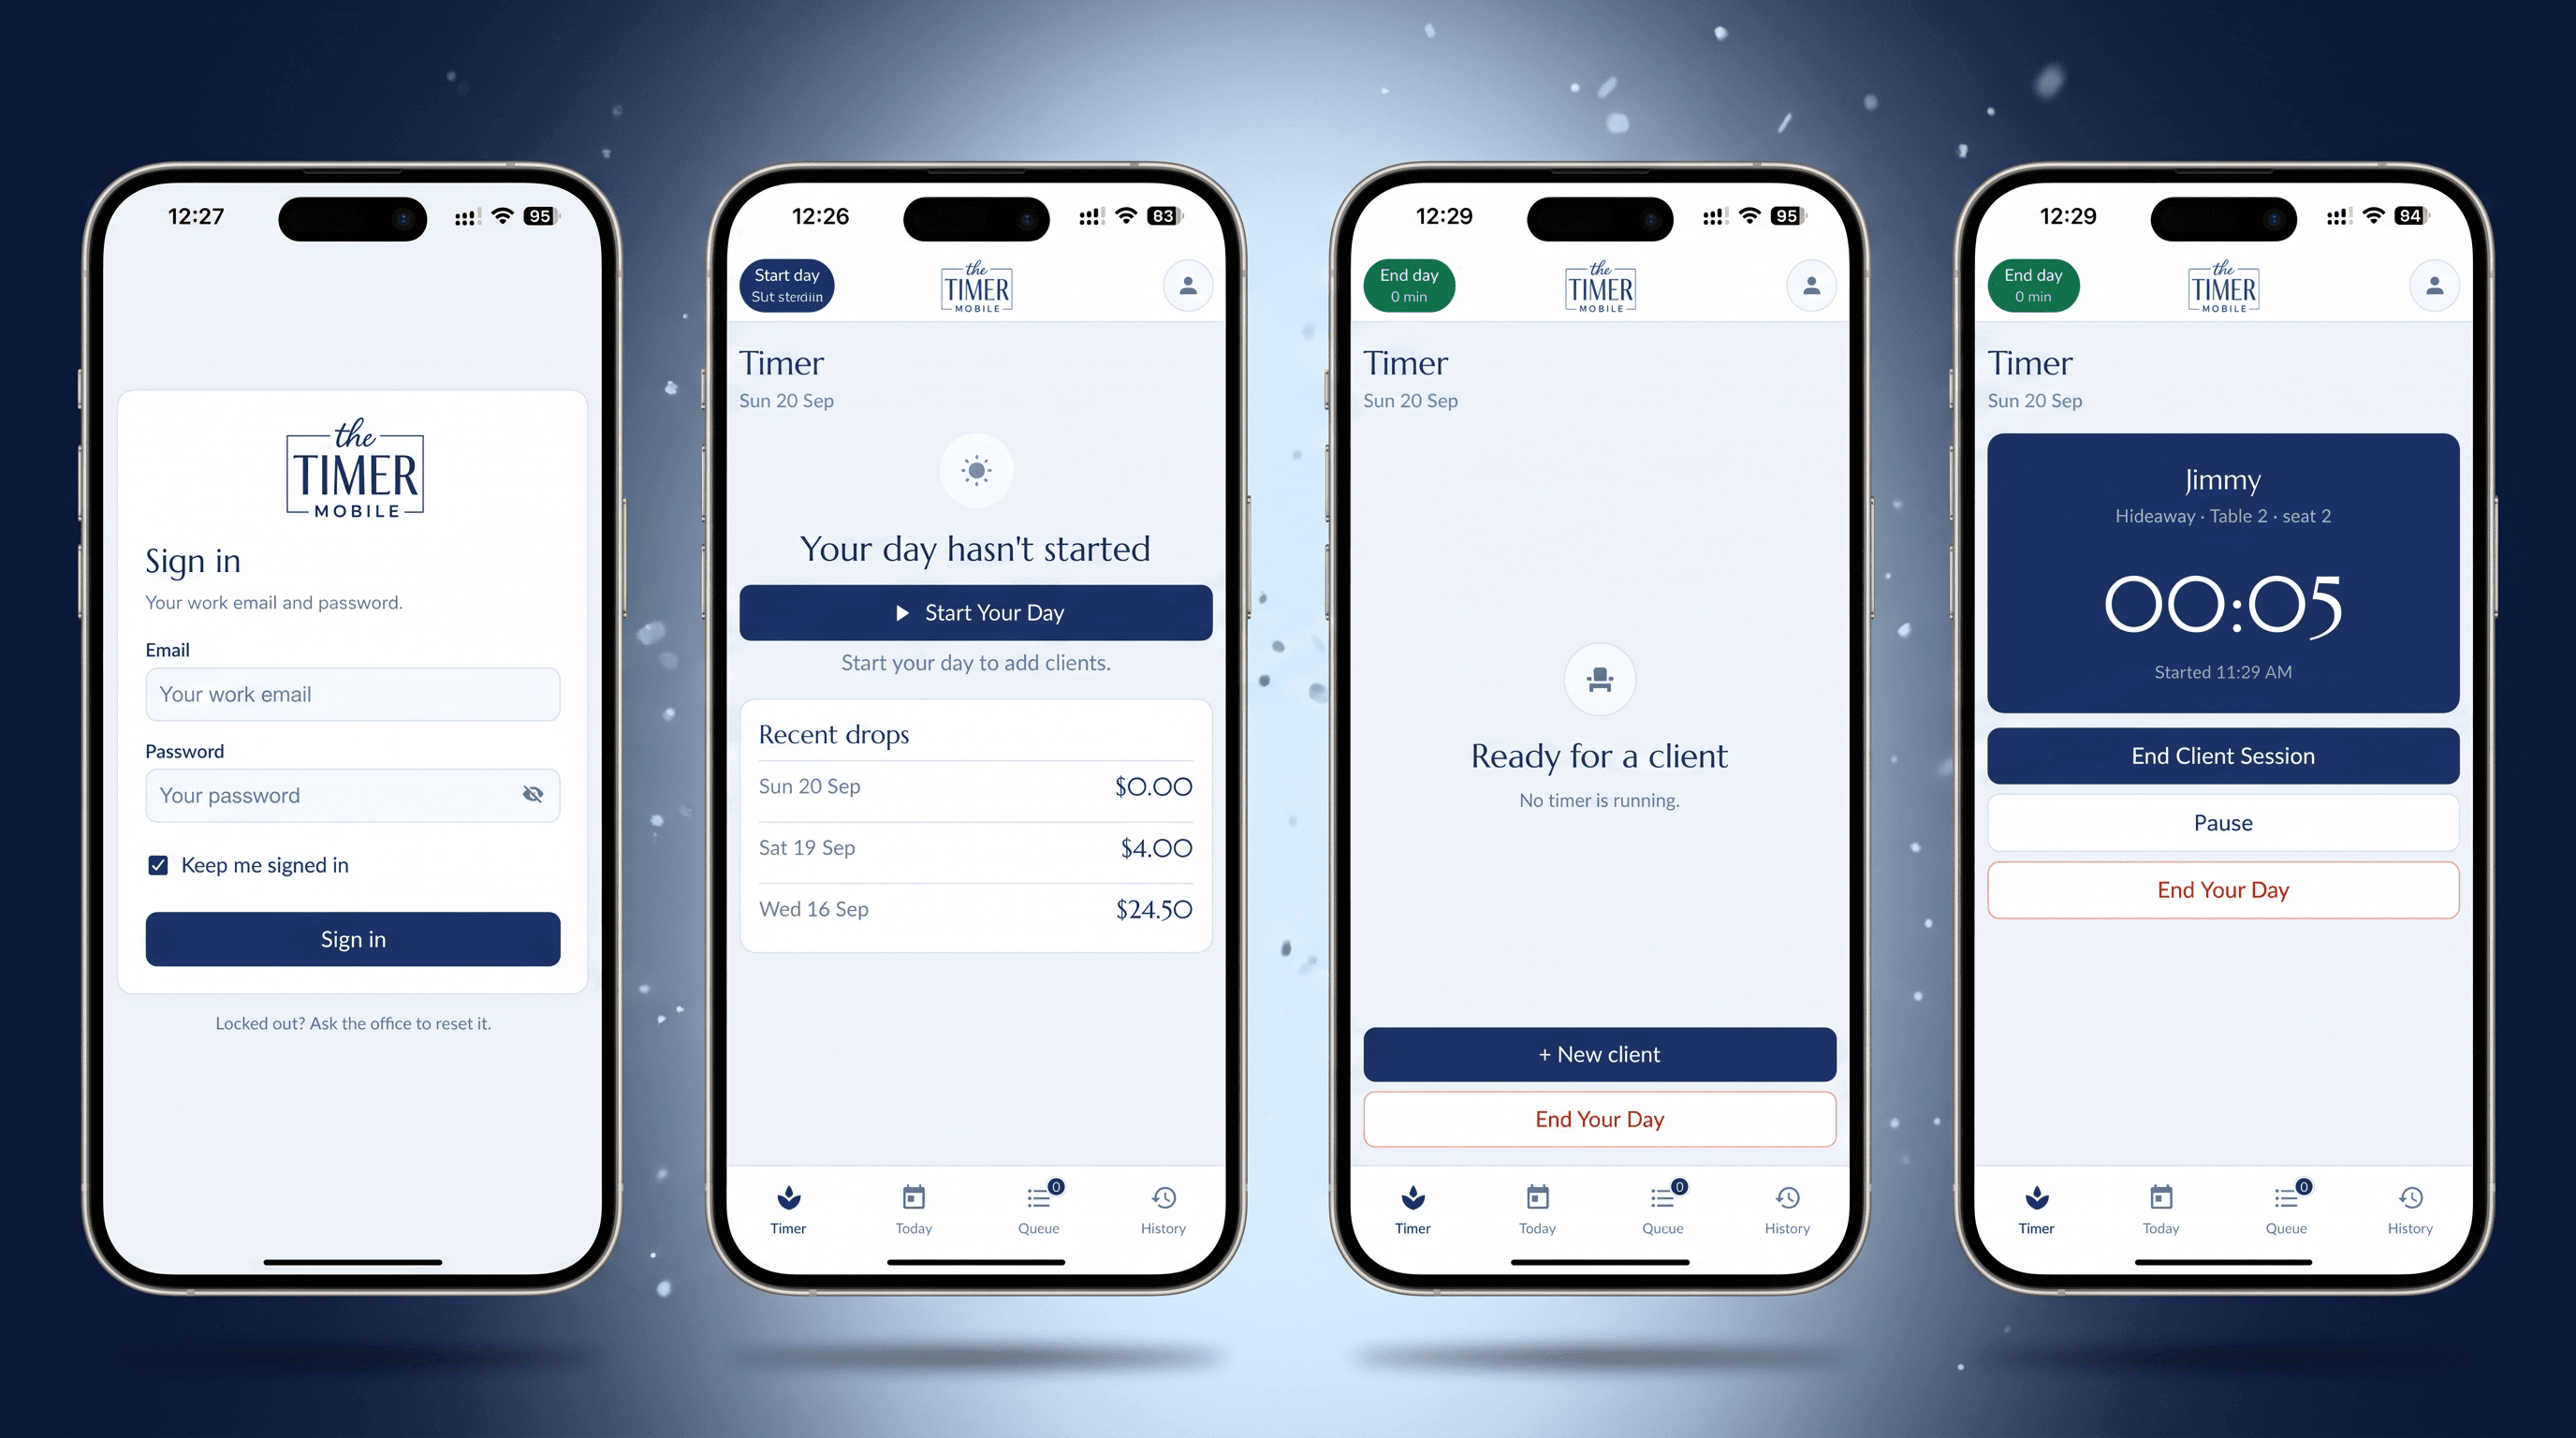
Premier Timer, iOS and Android App
Taking over from a departing programmer: an unfinished React Native app rebuilt and shipped to the App Store...

Deeve Technologies Portfolio, Next.js Rebuild
This site: my portfolio rebuilt from a custom WordPress theme onto Next.js 16, React 19 and Supabase, with...
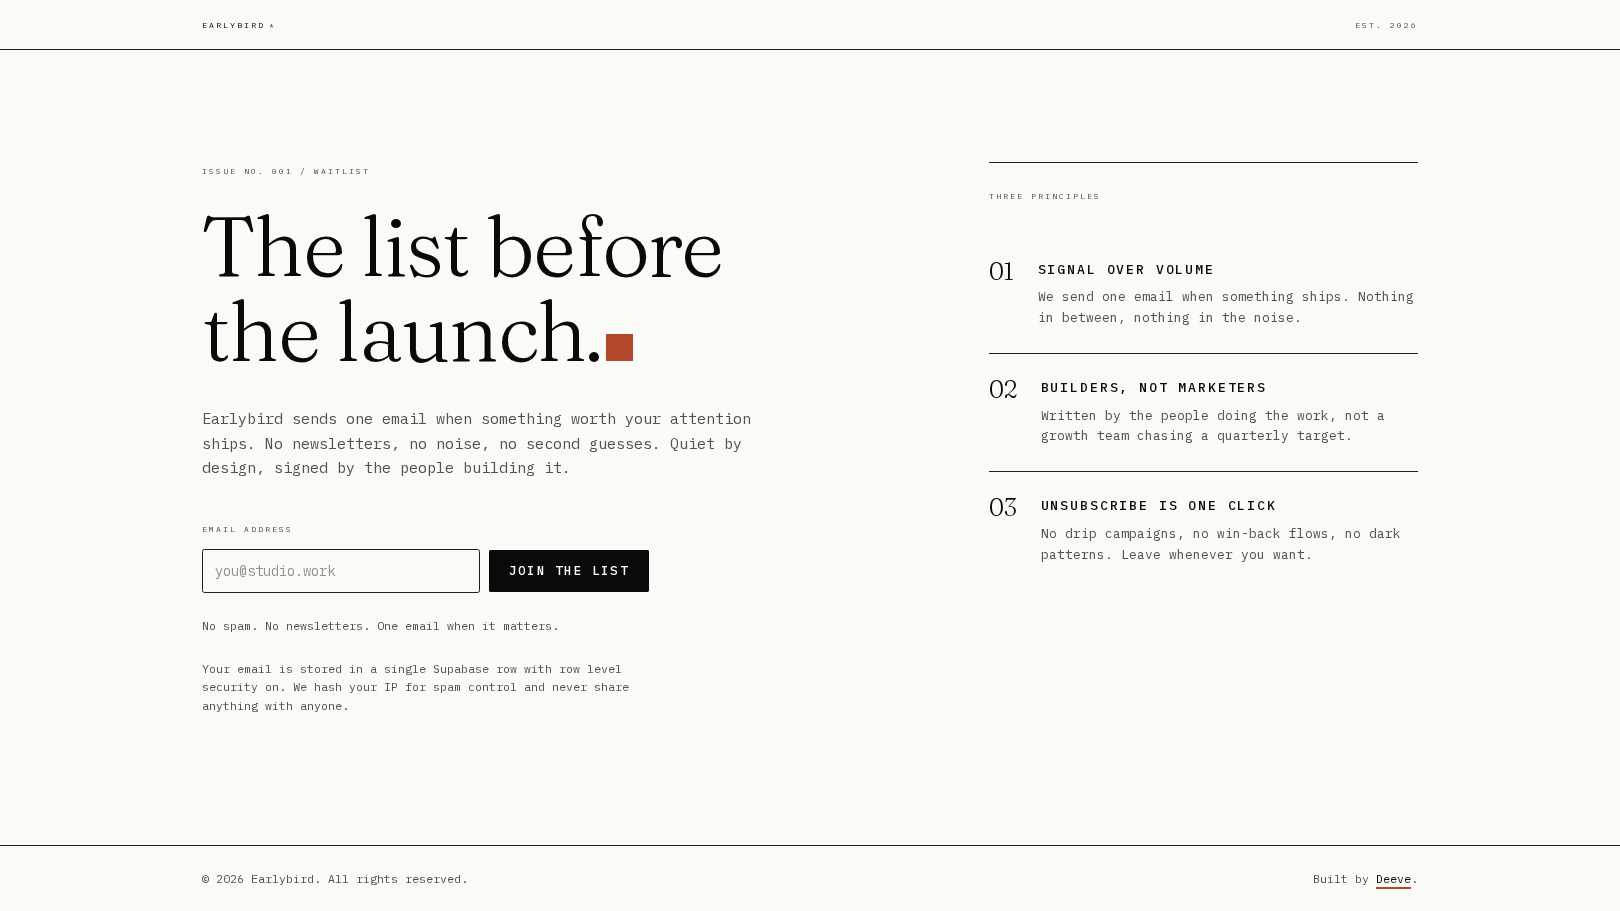
EarlyBird, Next.js Waitlist App
A minimalist waitlist application built with Next.js, TypeScript, and Supabase, deployed on Vercel. A...
I build software, and I measure whether it works.
The same questions I research are the ones I ask on client builds: is it reliable, is it fast, is it easy to use, and is it secure. Those four drove satisfaction in my ICT portal study, and they shape how I scope and test every project.